** Notice 04/27/2012 **
A leap year bug was discovered in the code for the bias correction of the daily CLARReS10 R2 and ERA data. The result is that an extra time step with all undefined values was erroneously added at the end of every leap year, which offsets the time axis of the bias corrected data. The affected netcdf files have been replaced and are all currently up to date. If you have downloaded any data before the date above, you may need to download some data sets again.
Welcome to the COAPS Regional Downscaling Data Server hosted at ftp://www.coaps.fsu.edu/pub/Southeast. This data set has been produced by Dr. Vasu Misra and Dr. Lydia Stefanova, in collaboration with Dr. Thomas Smith III and Dr. Steven C Chan.
About the COAPS regional downscaling
The COAPS Regional Downscaling for the Southeast United States datasets are the result of a USGS-funded collaborative project. They consist of two main components: downscaling of Global Reanalyses (sub-project CLARReS10) for the period 1979-2000, and downscaling of Global Climate Models (sub-project CLAREnCE10) for the periods 1968-2000 and 2038-2070. Click on the sub-project name for details.
General information
All downscaling has been performed using the FSU-FCI RSM adapted from Kanamitsu et al. (2010) at a 10km resolution, over the Southeast United States. For details of the regional model setup click here.
Data types
All data are in netCDF format. Two-dimensional variables (all surface meteorological variables, such as temperature, precipitation, etc.) are output each hour; three-dimensional model variables (vertical structure of the atmospheric temperature, humidity, wind, etc) are output every three hours. Click here for information on available variables. In addition to the raw model output, bias-correction has been performed on the daily averages of certain variables. Click here for details on the bias correction procedure.
Downloading the datasets
For downloading data click here.
Citing the datasets
For information on how to cite the data click here.
Resources
For a list of cited references click here.
Work with us
Please
Technical problems with this website?
Please
The COAPS Land-Atmosphere Regional Reanalysis downscaling for the Southeast United States at 10-km resolution consists of downscaling of two separate reanalyses*: the ERA-40 (Uppala et al 2006) and NCEP-DOE Reanalysis II (R2) (Kanamitsu et al 2002). The period covered by CLARReS10 is 1979-2000. Global reanalysis fields are supplied as boundary conditions to the regional model at 6-hourly intervals.
The downscaling of global atmospheric reanalysis was primarily done to objectively estimate the fidelity of the FSU-COAPS RSM for climate simulations over the southeast US. Global atmospheric reanalysis is a reconstruction of the historical global atmospheric circulations, in which all available observed data of the atmosphere are assimilated using a "frozen" version of a global atmospheric model. This atmospheric reanalysis offers a consistent dataset for relatively long periods of time to conduct climate analysis. However global atmospheric reanalysis are typically at coarse horizontal resolutions. Our effort with CLARReS10, in addition to testing the fidelity of the FSU-FCI RSM was to provide a high resolution atmospheric data set over the southeast US that would serve as a proxy for "observations" to conduct various application studies that are often plagued with inadequate and inconsistent meteorological input data.
Since global reanalyses are a "best guess" (not climate simulations) of the historical state of the atmosphere at any given time in the past, we have used the CLARReS10 dataset to validate the downscaling procedure against observations (Stefanova et al 2011, Misra et al 2011).
The COAPS Land-Atmosphere Regional Ensemble Climate Change Experiment for the Southeast United States at 10-km resolution (CLARREnCE10) consists of the downscaling of three separate Coupled Model Intercomparison Project (CMIP3) Coupled Global Circulation Models: the the Community Climate System Model (CCSM), the Hadley Centre Coupled Model, version 3 (HadCM3) and the Geophysical Fluid Dynamics Laboratory GCM (GFDL). The downscaling has been performed for the historical simulations (1968-2000) and the future projections (2038-2070) under the AR4 A2 emissions scenario. This emission scenario and its time period were chosen to match those used by the NARCCAP downscaling (50-km resolution over the continental United States) project.
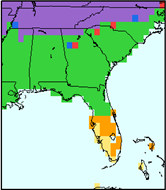
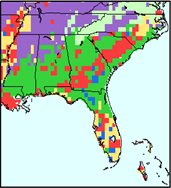
To evaluate the role of vegetation type in the regional downscaling, three different prescribed vegetation scenarios have been used, producing separate model output. These are: (a) the vegetation distribution as it would have been without modern human activity (Klein 2001, Hall et al 2005); (b) the current vegetation distribution (Loveland et al 1995, Loveland et al 2000) and (c) all vegetation to converted to agricultural crop (Feddema et al 2005).
(a)  |
(b)  |
 |
|
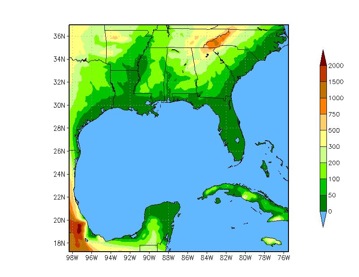
The Florida Climate Institute-Florida State University Land Atmosphere Reanalysis for the Southeastern United States at 10km Resolution version 1.0 dynamically downscales the 20th Century Reanalysis (20CR; Compo et al., 2011) over the period from 1903 to 2008 using the Regional Spectral Model (RSM; Kanamitsu et al., 2010). The RSM uses 6-hourly pressure, geopotential, temperature, humidity, and wind data from the 20CR as boundary conditions. The downscaled reanalysis domain ranges from roughly 17°N to 37°N and from 98°W to 76°W, encompassing the southeastern continental United States, the Gulf of Mexico, and the northwestern Caribbean Sea.
FLAReS1.0 provides a high-resolution climate reanalysis extending back over 100 years, which allows for the study of the effects of low frequency climate variations on local weather patterns, which have direct impacts on local hydrology and agriculture. Such studies are not possible with conventional reanalyses or observations because data is often unavailable in the early part of the 20th century. It is important to remember that the FLAReS1.0 data only serves as a proxy for observations. We have validated the reanalysis data against actual observations in DiNapoli and Misra (2012).
 |
The dynamical model used for the regional downscaling was the FSU-FCI RSM adapted from Kanamitsu et al. (2010). Within this model, we have used the Simplified Arakawa-Schubert Scheme (Pan and Wu, 1995) to parameterize deep convection, and the Noah land surface scheme (Ek et al, 2003) to parameterize the land surface processes. Lateral boundary conditions are provided by either a Global Reanalysis (CLARReS10) or a Coupled Global Circulation Model (CLAREnCE10) at 6-hour intervals throughout the integration. Scale-selective bias correction (Kanamitsu and Kanamaru, 2007) has been used to preserve the large-scale features of the boundary forcing within the regional domain. The regional domain, after removal of spurious sponge zone, is 24°N to 36°N, and 270°W (-90°E) to 284°W (-76°E).
Available variables
*Request additional variables by contacting
| Field | Name | Units | ||
|---|---|---|---|---|
| Hourly precipitation | pratesfc | [kg/m^2/s] | ||
| Hourly 2-m specific humidity | spfh2m | [kg/kg] | ||
| U, V at 10m | ugrd10m, vgrd10m | [m/s] | ||
| Temperature at 2m | tmp2m | [K] | ||
| SFC Downward short wave flux | dswrfsfc | [W/m^2] | ||
| SFC Latent heat flux | lhtflsfc | [W/m^2] | ||
| SFC Snowfall rate water equiv. | srweqsfc | [kg/m^2/s] | ||
| SFC Ground heat flux | gfluxsfc | [W/m^2] | ||
| SFC Roughness | sfcrsfc | [m] | ||
| SFC Sensible heat flux | shtflsfc | [W/m^2] | ||
| SFC Pressure | pressfc | [Pa] | ||
| Daily 2-m Tmin and Tmax | daily/tmin2m | [K] | ||
| daily/tmax2m | [K] |
All climate models have bias. Some form of bias correction is necessary when climate model output is to be used in applications. The simplest form of bias correction is the delta method (REF), which assumes that the model bias is additive and does not change in time.
To perform a bias correction with the delta method, one calculates the model’s projected long-term mean (P), the model’s historical simulation long-term mean (H), and the observed long-term mean (O). Prior to using the model output in applications, output values are corrected by adding the quantity (-H+O) in the case of historical simulations, and (-P+O) in the case of projections.
Precipitation fields cannot be corrected using the above approach due to the possibility of resulting negative precipitation values. We have produced daily bias-corrected precipitation fields using the quantile matching approach (Wood et al, 2002). This bias correction is done by creating cumulative distribution functions (CDFs) of precipitation values of the downscaled data on a month-by-month basis for each grid point. This process is repeated for the CPC gridded precipitation observation dataset. The CDFs are used to assign a percentile value to each downscaled and observed precipitation amount, and each downscaled precipitation amount is adjusted to equal the observed precipitation amount with the same percentile value. The bias corrected downscaled precipitation rates therefore have the same mean and variance as the observation dataset. Each precipitation value from the 21st century data is then linearly interpolated to the CDFs defined by the 20th century data and the bias correction process is repeated.
For CLARReS10:
Stefanova, L, V. Misra, S. C. Chan, M. Griffin, J. J. O’Brien and T. J. Smith III: A Proxy for High-Resolution Regional Reanalysis for the Southeast United States: Assessment of Precipitation Variability in Dynamically Downscaled Reanalyses. Clim Dyn, DOI: 10.1007/s00382-011-1230-y.
For CLAREnCE10:
Ek, M.B., K.E. Mitchell, Y. Lin, E. Rogers, P. Grunmann, V. Koren, G. Gayno, J.D. Tarpley, 2003: Implementation of the Noah land surface model advances in the National Centers for Environmental Prediction operational mesoscale Eta model. J. Geoph. Res., 108, D228851, doi:10.1029/2002JD003296.
Feddema, J. J., K. W. Oleson, G. B. Bonan, L. O. Mearns, L. E. Buja, G. A. Meehl, W. M. Washington, 2005: The importance of land-cover change in simulating future climates. Science, 310, 1674-1678
Hall, F.G., G. Collatz, S. Los, E. Brown de Colstoun, D. Landis, eds. ISLSCP Initiative II. NASA. DVD/CD-ROM. NASA, 2005.
Hong S-Y, H.-L. Pan, 1996: Nonlocal boundary layer vertical diffusion in a medium-range Forecast model. Mon. Wea. Rev., 124, 2322–2339.
Kanamaru H, M. Kanamitsu, 2007: Scale-selective bias correction in a downscaling of global analysis using a regional model. Mon. Wea. Rev., 135, 334-350.
Kanamitsu M., W. Ebisuzaki, J. Woollen, S.-K. Yang, J. Hnilo, M. Fiorino, and G. L. Potter, 2002: NCEP-DOE AMIP-II reanalysis (R-2), Bull. Amer. Meteorol. Soc., 83, 1631– 1643.
Kanamitsu, M., K. Yoshimura, Y.-B. Yhang, S.-Y. Hong, 2010: J. Geoph. Res., 115, D17115, doi:10.1029/2009JD013511
Klein Goldewijk, K., 2001. Estimating global land use change over the past 300 years: The HYDE database, Global Biogeochemical Cycles, 15, 417-433.
Loveland, T. R., J. W. Merchant, J. F. Brown, D. O. Ohlen, B. C. Reed, P. Olson, and J. Hutchinson, 1995: Seasonal land-cover regions of the United States. Ann. Assoc. Amer. Geogr., 85, 339–355.
Loveland, T.R., Reed, B.C., Brown, J.F., Ohlen, D.O., Zhu, J, Yang, L., and Merchant, J.W., 2000: Development of a Global Land Cover Characteristics Database and IGBP DISCover from 1-km AVHRR Data: International Journal of Remote Sensing, 21, 1303-1330.
Misra, V., L. Moeller, L. Stefanova, S. Chan, J. J. O'Brien, T. J. Smith III, and N. Plant, 2011: The influence of Atlantic warm pool on Florida Sea Breeze. J. Geophys. Res. (Atm) , 116, D00Q06, doi:10.1029/2010JD015367.
Pan H.-L., L. Mahrt, 1987: Interaction between soil hydrology and boundary layer developments. Boundary-Layer Meteorol., 38, 185-202.
Pan H.-L., W.-S. Wu, 1994: Implementing a mass-flux convective parameterization package for the NMC Medium Range Forecast Model. Preprints, 10th Conf. on Numerical Weather Prediction, Portland, OR, Amer. Meteorol. Soc., pp96–98.
Slingo J.M., 1987: The development and verification of a cloud prediction scheme for the ECMWF model. Q. J. Roy. Meteorol. Soc., 113, 899–927.
Stefanova, L., V. Misra, S. C. Chan, M. Griffin, J. J. O’Brien and T. J. Smith III, 2011: A Proxy for High-Resolution Regional Reanalysis for the Southeast United States: Assessment of Precipitation Variability in Dynamically Downscaled Reanalyses. Clim. Dyn., doi: 10.1007/s00382-011-1230-y.
Uppala S.M. et al, 2006: The ERA40 re-analysis. Q. J. Roy. Meteorol. Soc., doi 10.1256/ qj.04.176.
Wood, A.W., E.P. Maurer, A. Kumar, and D.P. Letternmaier, 2002: Long-range experimental hydrologic forecasting for the eastern United States. J. Geophys. Res., 107, 4429, doi:10.1029/2001JD000659.
latest edit: 2/23/2011 by Lydia Stefanova


